

Search Icon one-austin
Globe Icon Choose Your Country Select Icon

Choose Your Location

Learn about Austin Powder, our products, services, industries served, and how to contact us in the region that works best for you.

English Select a Language

Emissions

The carbon footprint assessment represents a key part of the decarbonization of Austin Powder’s activities, as it enables us to understand the organization’s direct and indirect emissions, identify the areas with the greatest impact on climate change and define actions to mitigate these emissions.

Greenhouse Gas Emissions

In 2025, Austin Powder achieved a notable improvement in greenhouse gas emissions intensity, both per unit of revenue and per unit of production, despite a year of significant operational growth. This improvement reflects continued efforts to optimize energy use, enhance process efficiency, and expand carbon-capture activities at key production facilities.
Greenhouse KPI Chart
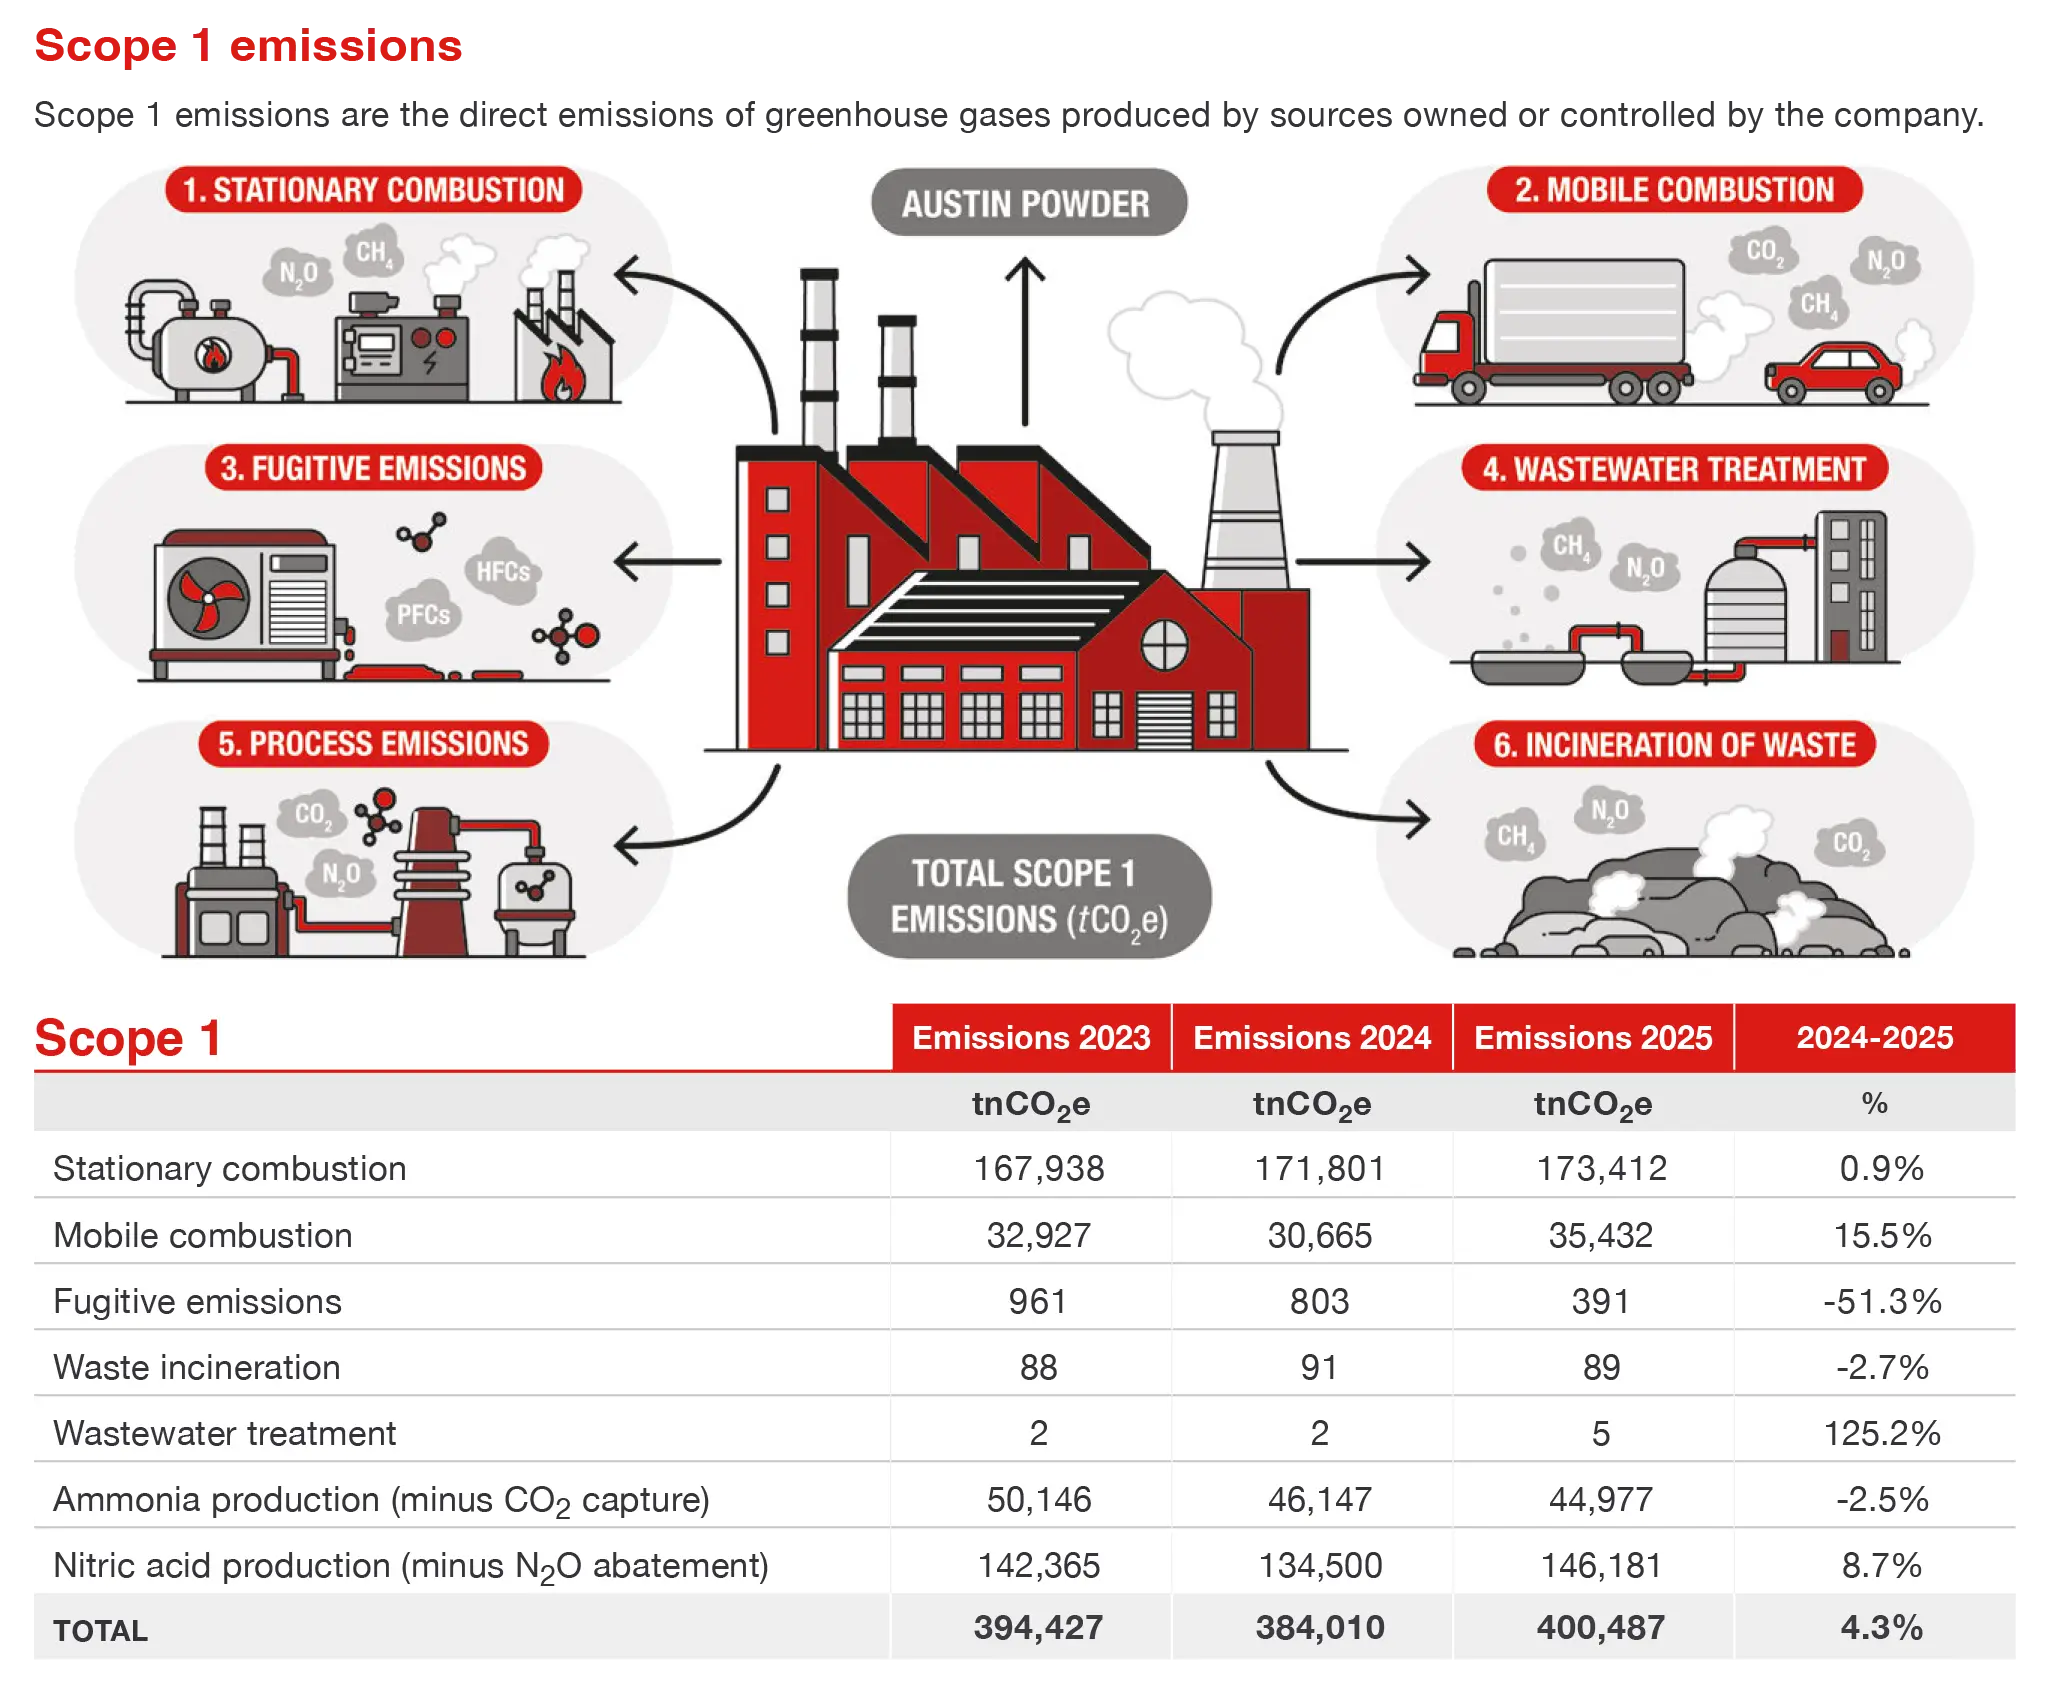
During the same period, total Scope 1 and Scope 2 greenhousegas emissions increased by 3.1% compared to 2024, primarilyas a result of higher production volumes across the Company’score products, including ammonia (5%), nitric acid (10.3%), andammonium nitrate (9.7%). The increase in absolute emissions istherefore closely linked to scale effects associated with businessgrowth in energy- and process-intensive operations.
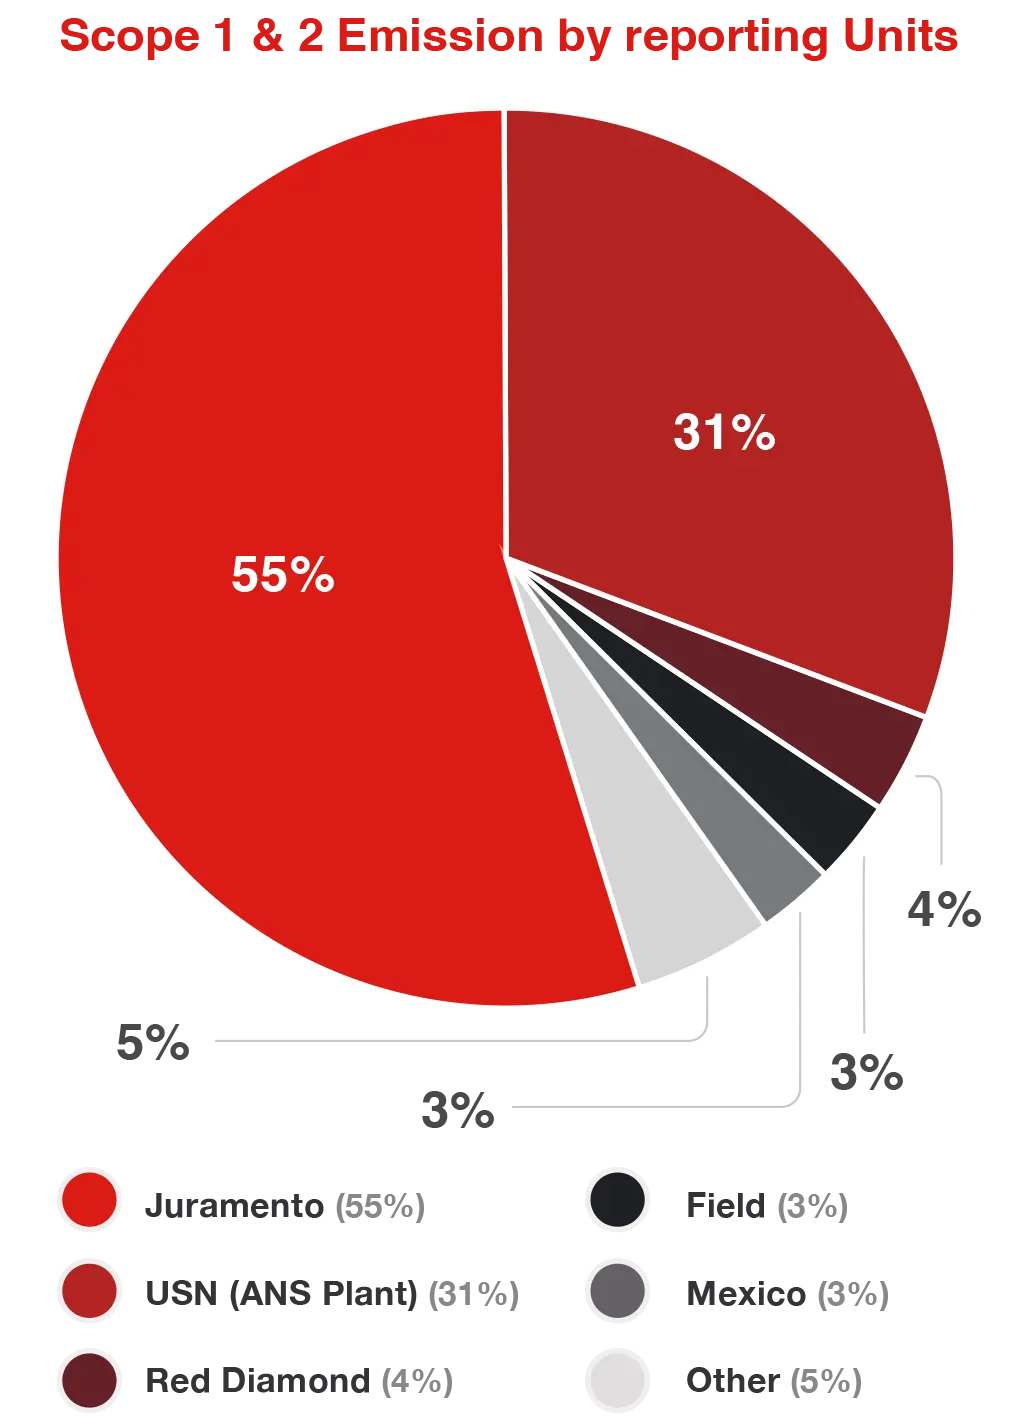
The Company’s emissions profile remains highly concentrated,with more than 86% of Scope 1 and Scope 2 emissionsgenerated by the USN and Juramento plants. Thisconcentration reinforces the strategic importance of thesefacilities as priority sites for ongoing efficiency improvementsand future decarbonization initiatives, where actions can deliverthe greatest relative impact.
Scope 1 and 2 Emissions
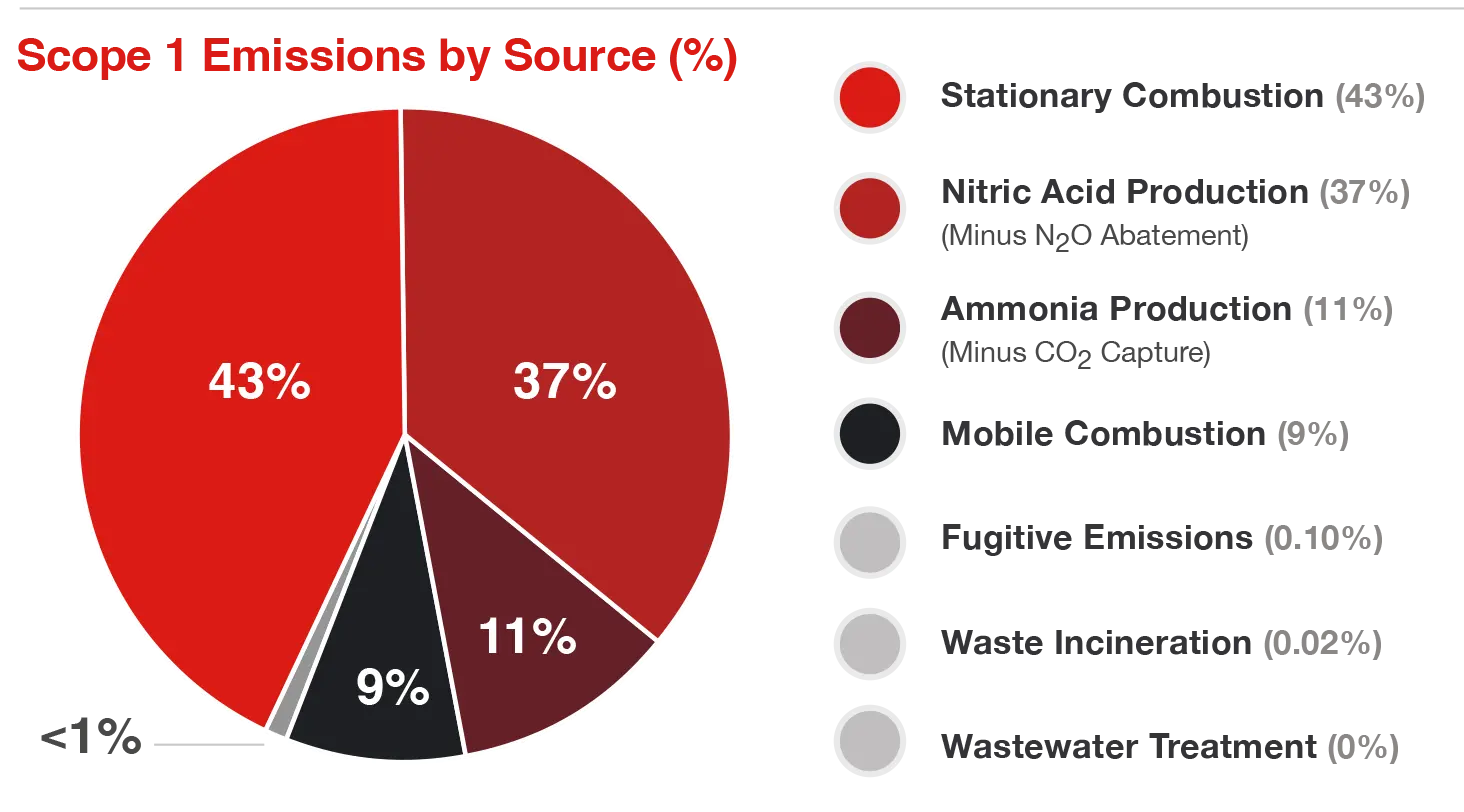
Scope 1 Emissions Graphic


Scope 2 Emissions

Scope 2 emissions represent the indirect greenhouse gas emissions resulting from the generation ofpurchased electricity, heat, or steam consumed in Austin Powder’s operations. These emissionsoccur at facilities owned or operated by third-party energy providers and are therefore indirect in nature.
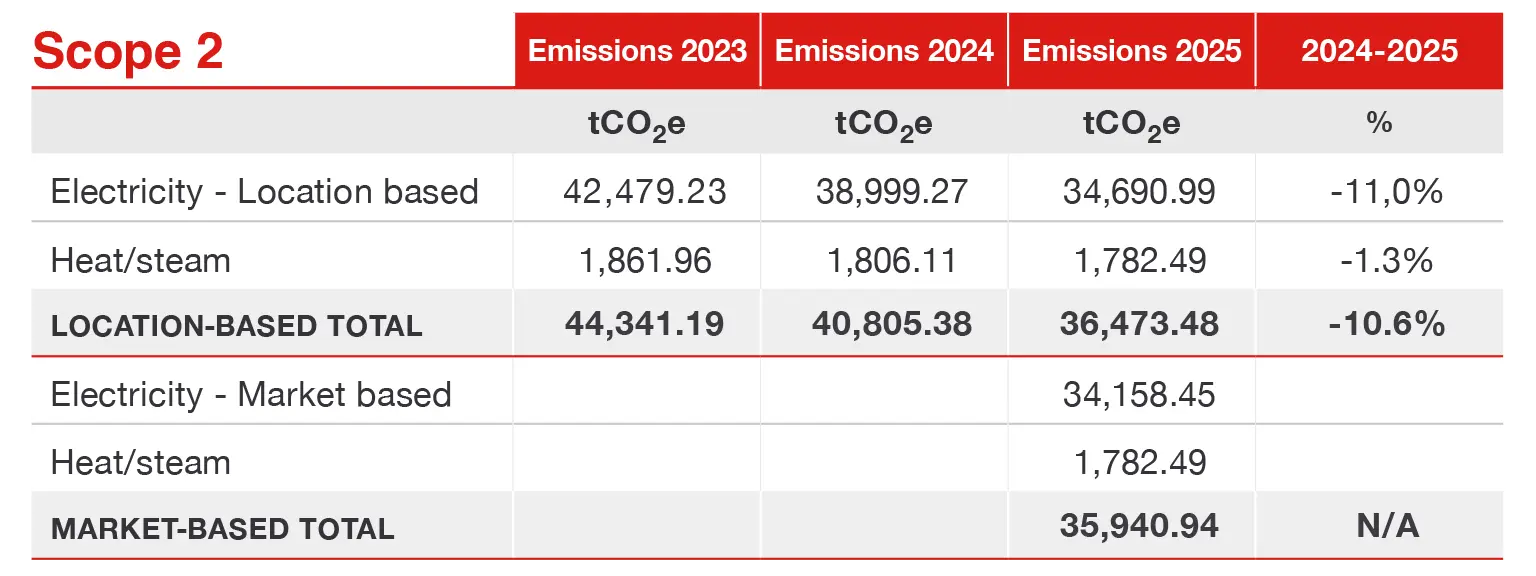
Using the location-based methodology, Scope 2 emissions declined compared to the previousyear, driven primarily by changes in grid emission factors in several operating regions, togetherwith reductions in electricity consumption at selected sites. Electricity continues to represent thepredominant source of Scope 2 emissions, while emissions associated with purchased heat andsteam remain comparatively limited.
During the year, the Company also strengthened its market-based Scope 2 calculation, enabling amore accurate reflection of emissions associated with the electricity sources contracted at site level.Improvements in data collection allowed Austin Powder to rely more extensively on supplier-specificemission factors, reducing dependence on average grid factors and enhancing the robustness andtransparency of reported results.
Sustainability Scope 2 Emissions Table


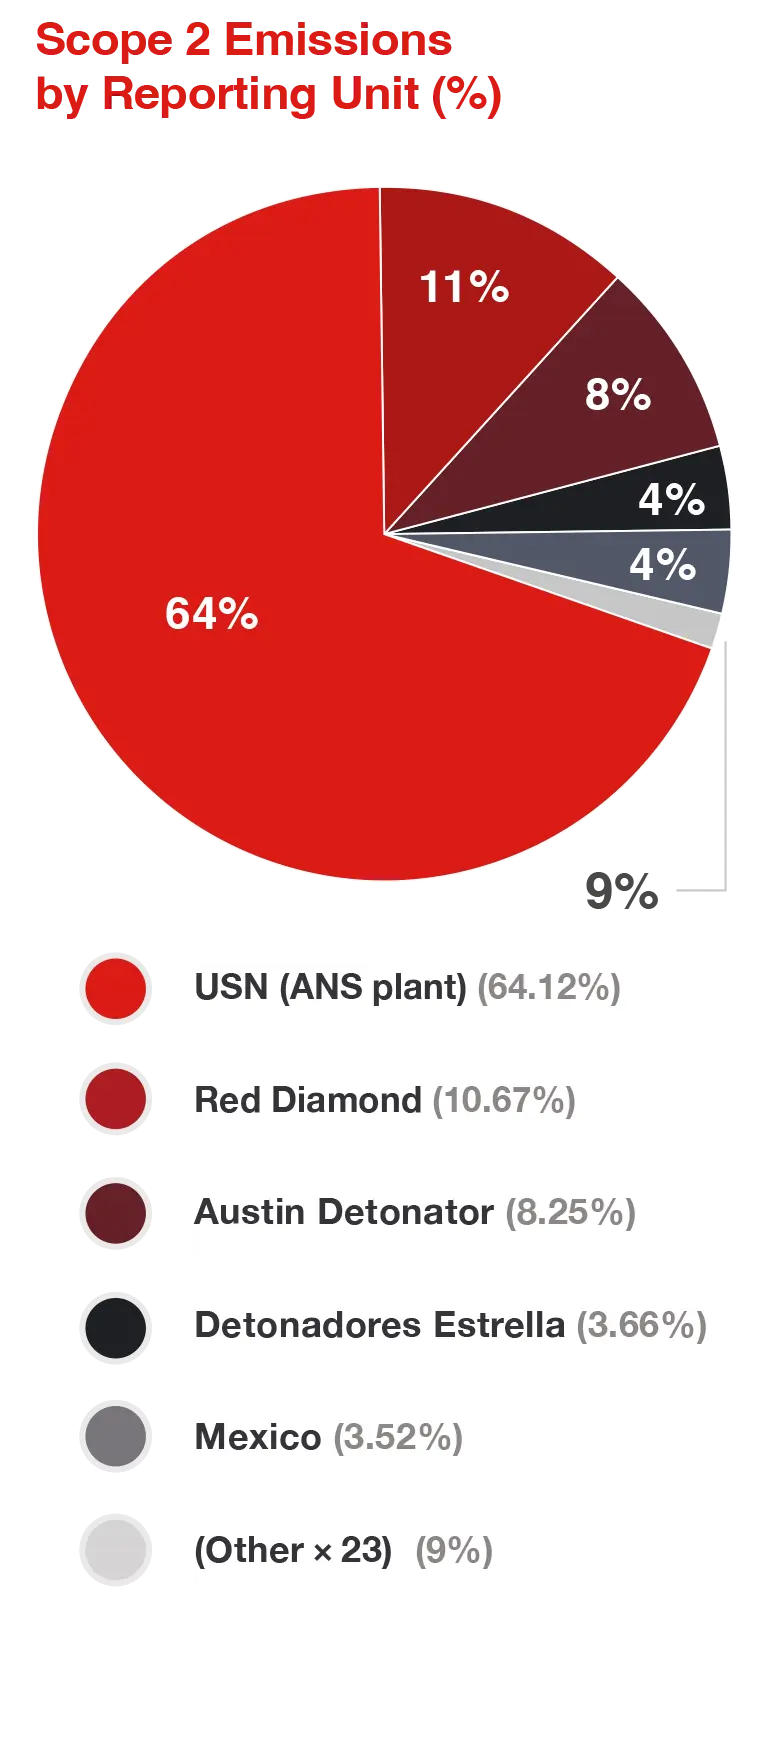
Scope 2 emissions remain highly concentrated in a small number of energy-intensive operations,with the USN facility representing the most significant contributor. This concentration underscoresthe strategic importance of energy-efficiency initiatives, electricity sourcing decisions, and futureelectrification efforts at a limited number of high-impact sites.
Overall, the reduction in Scope 2 emissions, together with improved methodological accuracy,highlights the role of electricity management as a key lever for reducing emissions intensitywhile supporting continued operational growth.

Results by Activity/Facility Type & Geography

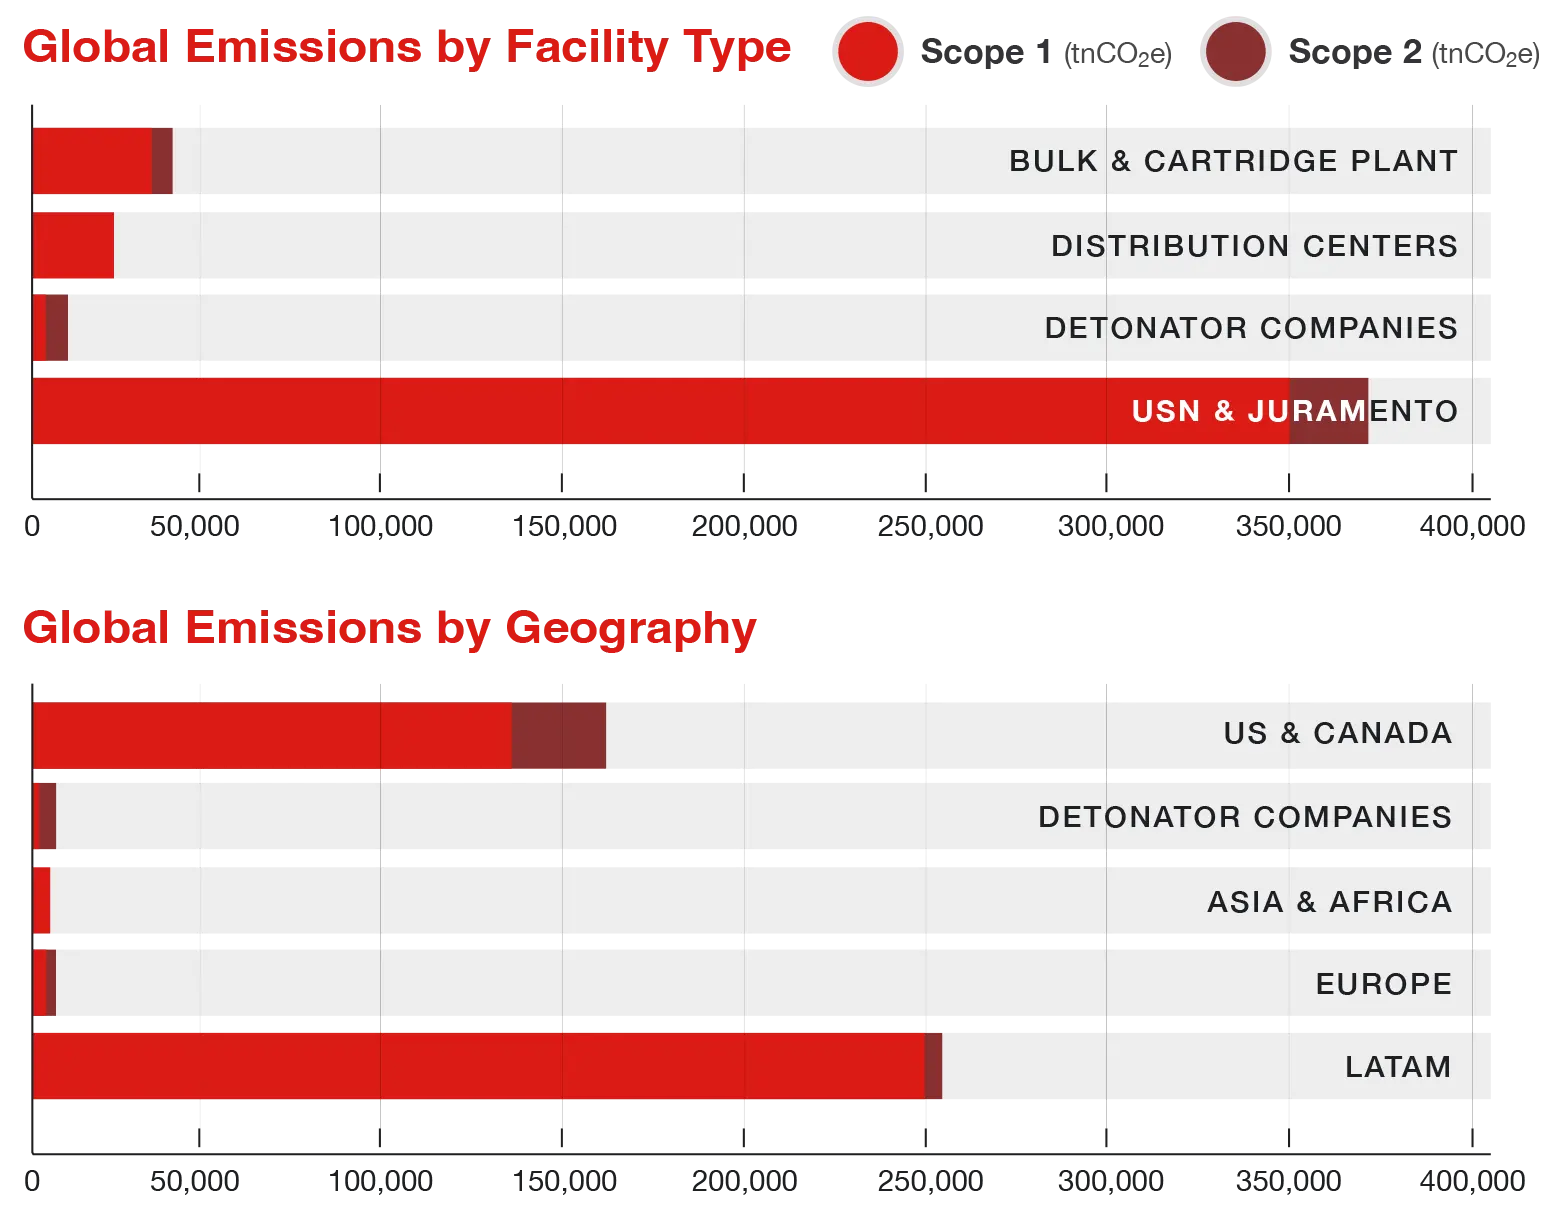
More than 85% of Austin Powder’s 2025 carbon footprint (Scopes 1 + 2, market-based) is concentrated in the USN and Juramento facilities, which together account for 31.06% and 54.72% of total emissions, respectively. Other notable contributors include US Field Operations, Red Diamond, and Mexico, representing 3.14%, 3.34%, and 2.76% of the company’s footprint. As a result, the United States and Latin America regions collectively account for more than 96% of Austin Powder’s total carbon footprint.
Global Emissions by Facility Type Chart

AUSTIN

DETONATOR

We are a traditional manufacturer of initiation systems for industrial blasting operations and an important technological and research base for production and further development of initiation systems.

Visit Site

AUSTIN POWDER

SERVICE CZ

Austin Powder Service CZ implements the latest technologies and products for blasting works, such as laser profiling, electronic modeling, and electronic detonators.

logo_white

We use cookies to personalize and improve your site experience, to see how you use our website and to integrate with social media. You have the option to "Accept All Cookies" or "Reject Non-Essential Cookies". Please refer to our Privacy Policy for more details.